Climate ready trees: Forest Service projections and who lists them
What the USDA Forest Service's modeling projects for eastern tree species in a warmer climate, set beside the growers listing each tree on HortOS and, for the species projected to at least double their habitat, a median trade price. With four regional ratings, projected hardiness zones for eight urban areas, and what the projections leave out.
Updated October 17, 2026. Figures are what the live us.hortosapp.com price and plant pages printed.
On this page
- Quick facts
- What the Forest Service modeled and how to read a ratio
- Trees projected to gain habitat, beside the growers listing them
- Four regions, four sets of ratings
- A different method for city trees
- What the projections and the counts do not show
- What to watch for
- Getting it right
- A word of caution
- Sources
A city forester in the eastern United States, drafting next decade's planting list, asks which tree species are projected to gain ground in a warmer climate, and whether growers list them. In 2019 the USDA Forest Service modeled 125 eastern species. Averaged across its scenarios, about 88 would gain at least 10 percent of their suitable habitat and 26 would lose as much. A Forest Service habitat ratio measures the habitat that may suit a species under a future climate, which the agency says may not be where the species ends up growing.
This page draws on the two 2019 papers behind that modeling, the 2024 regional handouts of the USDA Northern Forests Climate Hub, and the urban tree handouts of the Northern Institute of Applied Climate Science (NIACS). It adds what HortOS, a free directory of American wholesale plant growers with their published availability and trade prices, shows for each species: the growers listing it and, where enough of them price one size, a median. It is not a planting list, a recommendation of any species, or a forecast for one site.
Quick facts
| The modeling | The USDA Forest Service modeled 125 tree species growing east of the 100th meridian under RCP 4.5 and RCP 8.5, its two emission pathways, and three climate models (Northern Research Station, eastern United States, 2019). |
|---|---|
| Gains and losses | Averaged across the scenarios, about 88 of the 125 species gain at least 10 percent of their suitable habitat and 26 lose at least 10 percent (USDA Forest Service, eastern United States, 2019). |
| Reading a ratio | In the Forest Service's tables a future to current habitat ratio above 1.1 is a gain, one below 0.9 is a loss, and anything between is no change (USDA Forest Service, eastern United States, 2019). |
| Model reliability | The Forest Service scored 29 of its 125 species models as high reliability, 47 as medium and 49 as lower (USDA Forest Service, eastern United States, 2019). |
| The stated limit | The Forest Service says a projected increase in range probably overstates where a species will actually grow by the end of the century, unless people move it (USDA Forest Service, eastern United States, 2019). |
| On HortOS | 22 of the 27 trees in this page's first table had a median trade price on HortOS, each at the container size most growers price. |
What the Forest Service modeled and how to read a ratio
The Forest Service's Northern Research Station modeled each species under two emission pathways, RCP 4.5 (lower) and RCP 8.5 (high), and three climate models (eastern United States, 2019). Table A1 of its paper gives every species a future to current ratio of suitable habitat for each pathway, the mean of the three climate models. On the paper's scale a ratio above 1.1 is a gain and one below 0.9 is a loss (Forest Service, eastern United States, 2019). A ratio covers the whole study area, from the 100th meridian east. It is not a figure for a state, a city or a planting site.
Among the 88 species with growing habitat, 42 at least double it under RCP 4.5 and 55 under RCP 8.5 (Forest Service, eastern United States, 2019). The paper names southern red oak, water oak, shortleaf pine and longleaf pine as southern species whose suitable habitat is expected to spread north (Forest Service, eastern United States, 2019).
The phrase climate-ready trees comes from the other side of the country. The Forest Service's Pacific Southwest Research Station uses it for a varied mix of tree species suited to the conditions expected ahead, in a paper on performance trials in three regions of California (California, 2018). The eastern ratings have another basis: statistical modeling of suitable habitat, adaptability judged from published literature and expert opinion, and abundance taken from inventory data (Climate Hub, Mid-Atlantic, 2024).
Trees projected to gain habitat, beside the growers listing them
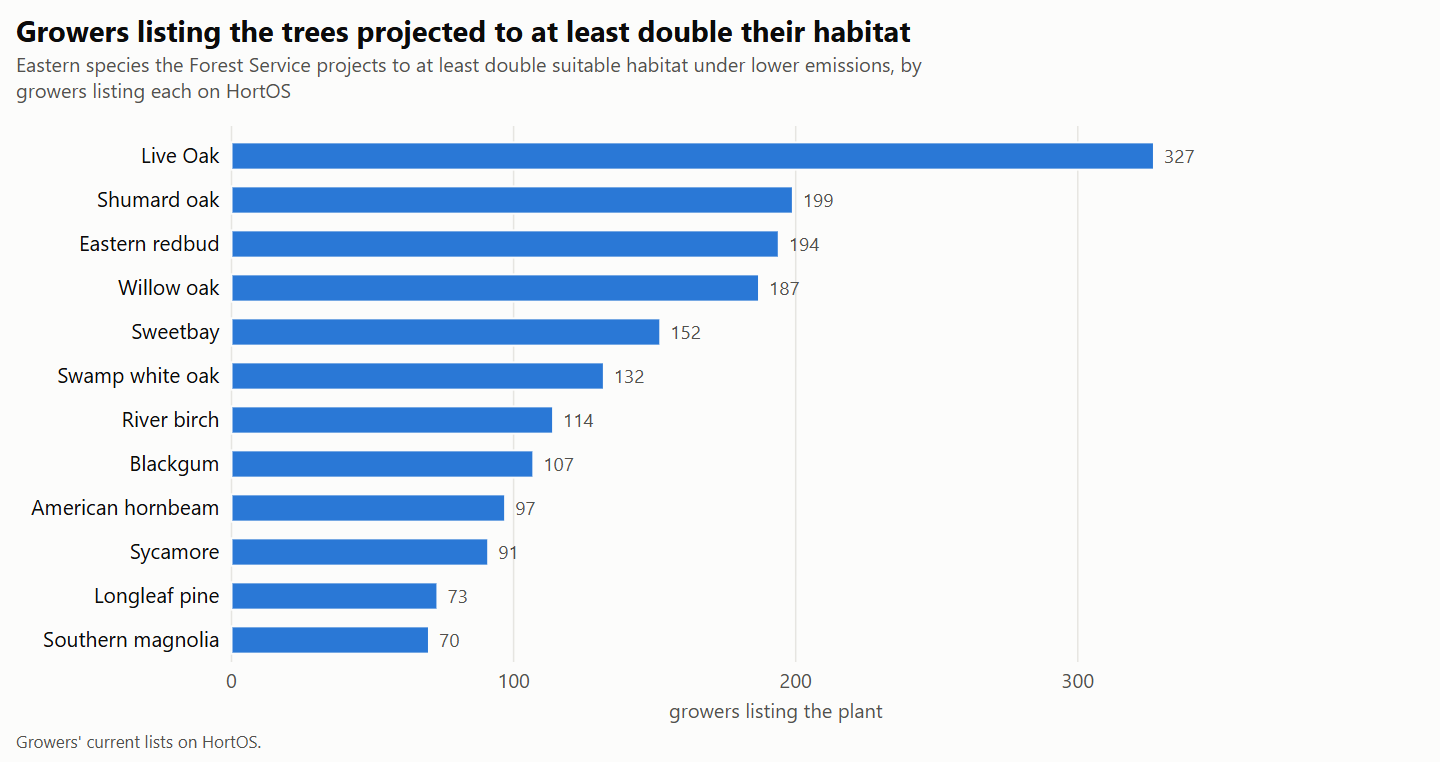
The first table takes the class the paper counts as at least doubling suitable habitat under RCP 4.5: 42 species in its Table A1 (Forest Service, eastern United States, 2019). It shows 27 of the 42, ordered by the growers listing each, and 15 are not shown. The word in brackets is the Forest Service's reliability score for that species' model.
Prices are medians across growers' current trade lists on HortOS: one price per grower, ex tax, freight not included, with the number of growers pricing each size in brackets. Grower counts are the growers listing each plant on HortOS, in any size. A count here is growers listing the plant, not how many plants exist or how well it suits a site. Anyone can see the prices on HortOS, and only the trade can order.
| Plant | Future to current habitat ratio, RCP 4.5 / RCP 8.5, and model reliability (USDA Forest Service, 2019) | Growers listing it | Size most growers price | Median (growers pricing) |
|---|---|---|---|---|
| Live Oak (Quercus virginiana) | 3.789 / 7.552 (high) | 327 | #45 | $265 (107) |
| Shumard oak (Quercus shumardii) | 2.050 / 3.989 (low) | 199 | #30 | $125 (40) |
| Eastern redbud (Cercis canadensis) | 2.118 / 3.189 (low) | 194 | #15 | $77.50 (28) |
| Willow oak (Quercus phellos) | 2.625 / 3.336 (low) | 187 | #15 | $60 (35) |
| Sweetbay (Magnolia virginiana) | 2.798 / 3.129 (medium) | 152 | #15 | $62.50 (32) |
| Swamp white oak (Quercus bicolor) | 2.713 / 3.077 (low) | 132 | #7 | $37.75 (10) |
| River birch (Betula nigra) | 4.053 / 6.875 (low) | 114 | #30 | $125 (20) |
| Blackgum (Nyssa sylvatica) | 2.037 / 2.450 (medium) | 107 | #3 | $14.50 (17) |
| American hornbeam (Carpinus caroliniana) | 2.913 / 3.756 (low) | 97 | #3 | $14 (7) |
| Sycamore (Platanus occidentalis) | 2.803 / 4.053 (low) | 91 | #15 | $60 (16) |
| Longleaf pine (Pinus palustris) | 2.933 / 3.507 (medium) | 73 | #3 | $10 (23) |
| Southern magnolia (Magnolia grandiflora) | 6.490 / 8.227 (low) | 70 | #15 | $80 (13) |
| Cabbage Palm (Sabal palmetto) | 2.337 / 3.123 (medium) | 67 | #7 | $40 (4) |
| Pond Cypress (Taxodium ascendens) | 2.467 / 3.457 (medium) | 67 | #30 | $112.50 (14) |
| Persimmon (Diospyros virginiana) | 4.039 / 7.027 (low) | 64 | #3 | $12 (14) |
| Cedar elm (Ulmus crassifolia) | 7.557 / 15.895 (medium) | 61 | #45 | $227.50 (12) |
| American holly (Ilex opaca) | 2.018 / 2.304 (medium) | 34 | #3 | $29.75 (6) |
| Eastern hophornbeam (Ostrya virginiana) | 2.599 / 3.017 (low) | 34 | #15 | $75 (3) |
| Southern red oak (Quercus falcata) | 2.697 / 3.659 (medium) | 25 | #3 | $12.47 (4) |
| Black willow (Salix nigra) | 2.458 / 4.558 (low) | 20 | #1 | $8.00 (3) |
| Winged elm (Ulmus alata) | 3.137 / 4.597 (medium) | 20 | #15 | $61.25 (4) |
| Silver maple (Acer saccharinum) | 2.309 / 2.630 (low) | 18 | #5 | $34.50 (4) |
| Eastern cottonwood (Populus deltoides) | 2.881 / 4.034 (low) | 15 | Fewer than three growers | |
| Shortleaf pine (Pinus echinata) | 2.796 / 3.665 (high) | 12 | Fewer than three growers | |
| Post oak (Quercus stellata) | 3.077 / 4.504 (high) | 11 | Fewer than three growers | |
| Blackjack oak (Quercus marilandica) | 5.241 / 9.588 (medium) | 6 | Fewer than three growers | |
| Bluejack oak (Quercus incana) | 2.678 / 5.097 (low) | 4 | Fewer than three growers |
The growers listing the plants in this table are spread across many states; the most are in Florida, Texas and North Carolina. The size shown for each plant is the container size most growers price; field grown lines are not counted, and palms and other plants sold by height are not priced above #15.
The container sizes in the table run from #1 to #45, so its medians are not like for like and do not rank the trees by price. The size shown is not the biggest size growers list, and it is not a caliper size. The guide to street trees and canopy looks at the bigger containers that cities plant.
The medians for silver maple (4 growers pricing), eastern hophornbeam (3), southern red oak (4), cabbage palm (4), winged elm (4) and black willow (3) each rest on fewer than five growers. A median on three or four growers is a thin reading that one grower's list can move, and the count beside each median shows how many stand behind it. A cell that reads Fewer than three growers means too few growers price any one container size for a median.
Most rows carry a low or medium reliability score, and the paper reports the same pattern. Of the 88 species gaining at least 10 percent of habitat, 12 had highly reliable models, against 12 of the 26 losing that much (Forest Service, eastern United States, 2019).
The second table holds species with a smaller projected gain: a ratio above 1.1 under both pathways, but short of doubling at RCP 4.5 (Forest Service, eastern United States, 2019). It shows 40 of them, and 6 are not shown. It prints counts only and gives no price for these trees. A median needs three growers pricing a size. Its last column names the states where the most growers list each tree.
| Plant | Future to current habitat ratio, RCP 4.5 / RCP 8.5, and model reliability (USDA Forest Service, 2019) | Growers listing it | States with most growers |
|---|---|---|---|
| Nuttall Oak (Quercus texana) | 1.361 / 1.589 (low) | 154 | Florida 34, Georgia 24, North Carolina 18 |
| Loblolly pine (Pinus taeda) | 1.212 / 1.324 (high) | 133 | Florida 31, Texas 31, North Carolina 12 |
| White oak (Quercus alba) | 1.317 / 1.330 (medium) | 113 | North Carolina 17, Georgia 13 |
| Bur oak (Quercus macrocarpa) | 1.859 / 1.816 (medium) | 108 | Texas 31, Tennessee 12, Georgia 6 |
| Pin oak (Quercus palustris) | 1.347 / 1.970 (low) | 108 | North Carolina 17, Tennessee 12, New Jersey 11 |
| Northern red oak (Quercus rubra) | 1.478 / 1.416 (medium) | 102 | Tennessee 15, North Carolina 14, Pennsylvania 9 |
| Slash pine (Pinus elliottii) | 1.577 / 1.858 (high) | 101 | Florida 93, Georgia 5 |
| Sweetgum (Liquidambar styraciflua) | 1.479 / 1.730 (high) | 89 | Florida 35, Tennessee 9, Texas 9 |
| Chinkapin oak (Quercus muehlenbergii) | 1.484 / 1.613 (medium) | 80 | Texas 30, Georgia 9, Tennessee 5 |
| Scarlet oak (Quercus coccinea) | 1.168 / 1.208 (medium) | 60 | North Carolina 10, Oregon 6 |
| American elm (Ulmus americana) | 1.799 / 2.218 (medium) | 60 | Florida 30, Tennessee 6, Georgia 4 |
| Common hackberry (Celtis occidentalis) | 1.861 / 2.076 (medium) | 59 | North Carolina 7, Oregon 7, Pennsylvania 6 |
| Flowering dogwood (Cornus florida) | 1.607 / 1.765 (medium) | 52 | Oregon 9, New Jersey 6 |
| American beech (Fagus grandifolia) | 1.163 / 1.193 (high) | 46 | North Carolina 6, Tennessee 6, Maryland 6 |
| American basswood (Tilia americana) | 1.496 / 1.336 (medium) | 34 | Pennsylvania 4 |
| Red mulberry (Morus rubra) | 1.955 / 2.345 (low) | 27 | Florida 15, North Carolina 3 |
| Black walnut (Juglans nigra) | 1.678 / 2.069 (low) | 24 | Texas 3, New Jersey 3 |
| Black cherry (Prunus serotina) | 1.477 / 1.466 (medium) | 24 | Pennsylvania 6, Florida 4 |
| Sassafras (Sassafras albidum) | 1.871 / 2.346 (low) | 24 | Tennessee 4, New Jersey 4 |
| Pignut hickory (Carya glabra) | 1.280 / 1.401 (medium) | 22 | Florida 13, Tennessee 2 |
| Boxelder (Acer negundo) | 1.637 / 1.889 (low) | 18 | North Carolina 4, Pennsylvania 3, Texas 2 |
| Black oak (Quercus velutina) | 1.962 / 2.273 (high) | 18 | Pennsylvania 3, Maryland 2, Massachusetts 2 |
| Shagbark hickory (Carya ovata) | 1.281 / 1.262 (medium) | 16 | North Carolina 3 |
| Atlantic white-cedar (Chamaecyparis thyoides) | 1.704 / 1.542 (low) | 16 | Maryland 4 |
| Chestnut oak (Quercus prinus) | 1.191 / 1.233 (high) | 11 | Tennessee 3, Maryland 2 |
| Water hickory (Carya aquatica) | 1.380 / 1.641 (medium) | 10 | Florida 6, Georgia 2 |
| Tamarack (Larix laricina) | 1.238 / 1.215 (high) | 10 | Minnesota 3, Pennsylvania 2, New Jersey 2 |
| Gray birch (Betula populifolia) | 1.154 / 1.191 (low) | 9 | Pennsylvania 4 |
| Bitternut hickory (Carya cordiformis) | 1.859 / 2.315 (low) | 8 | North Carolina 2, Tennessee 2 |
| Loblolly Bay (Gordonia lasianthus) | 1.651 / 1.712 (medium) | 8 | Florida 8 |
| Osage-orange (Maclura pomifera) | 1.755 / 2.408 (medium) | 8 | 8 states with 1 each |
| Redbay (Persea borbonia) | 1.839 / 2.078 (low) | 6 | Florida 6 |
| Northern Pin Oak (Quercus ellipsoidalis) | 1.909 / 1.733 (medium) | 6 | Oregon 2, Illinois 2 |
| Shellbark hickory (Carya laciniosa) | 1.241 / 1.340 (low) | 5 | North Carolina 2, Tennessee 2, Pennsylvania 1 |
| Water tupelo (Nyssa aquatica) | 1.377 / 1.587 (medium) | 5 | North Carolina 2 |
| Swamp tupelo (Nyssa biflora) | 1.816 / 1.991 (medium) | 5 | North Carolina 3, Florida 2 |
| Sand Pine (Pinus clausa) | 1.413 / 1.275 (medium) | 5 | Florida 3, Oregon 2 |
| Turkey Oak (Quercus laevis) | 1.258 / 1.327 (medium) | 5 | Florida 4, Tennessee 1 |
| Fraser Magnolia (Magnolia fraseri) | 1.540 / 1.653 (low) | 4 | Pennsylvania 2, Illinois 1, Tennessee 1 |
| Slippery elm (Ulmus rubra) | 1.774 / 2.453 (low) | 2 | Georgia 1, Pennsylvania 1 |
The last column names the states with the most growers listing each plant, three at most, and stops where states tie for the next place.
An East-wide gain is not a regional rating. Bur oak gains habitat across the East in this table. The Mid-Atlantic handout rates the same tree as rare in that region, with shrinking habitat and poor capability under both scenarios (Climate Hub, Mid-Atlantic, 2024).
Four regions, four sets of ratings
The Climate Hub and NIACS publish handouts that rate species one region at a time, each under a low and a high emissions scenario for 2070 to 2099 (Mid-Atlantic, 2024). Capability is their word for how well a species is expected to cope or hold on in that region as the climate changes. Good means growing habitat, adaptability that is medium or high, and a species that is common or abundant there. Poor means shrinking habitat, adaptability that is medium or low, and a species that is uncommon or rare. Fair covers the mixed cases, and New habitat marks a species the Tree Atlas projects habitat for where it does not grow today (Climate Hub, Mid-Atlantic, 2024). The rating is moved down for a rare species and up for an abundant one, so the same tree can rate differently from region to region.
The third table shows 25 species that all four handouts rate. Each cell gives the capability rating under low emissions, then under high emissions.
| Tree | New England and northern New York (USDA Northern Forests Climate Hub, 2024) | Mid-Atlantic (USDA Northern Forests Climate Hub, 2024) | Central Appalachians (USDA Northern Forests Climate Hub, 2024) | Illinois (USDA Northern Forests Climate Hub, 2024) |
|---|---|---|---|---|
| American basswood | Good / Good | Good / Good | Poor / Poor | Poor / Poor |
| American beech | Good / Good | Fair / Fair | Fair / Poor | Poor / Poor |
| American elm | Fair / Good | Good / Good | Fair / Good | Good / Good |
| Black cherry | Good / Good | Fair / Fair | Fair / Fair | Poor / Poor |
| Black oak | Good / Good | Good / Good | Good / Good | Fair / Fair |
| Blackgum | Good / Good | Good / Good | Good / Good | Good / Good |
| Bur oak | Poor / Poor | Poor / Poor | Poor / Poor | Poor / Poor |
| Chestnut oak | Good / Good | Good / Good | Good / Good | Fair / Fair |
| Chinkapin oak | New habitat | Good / Good | Good / Good | Poor / Poor |
| Eastern white pine | Fair / Fair | Poor / Poor | Poor / Poor | Poor / Poor |
| Flowering dogwood | Poor / Good | Poor / Poor | Good / Good | Poor / Fair |
| Loblolly pine | New habitat | Fair / Good | Good / Good | Good / Good |
| Mockernut hickory | Good / Good | Good / Good | Good / Good | Good / Good |
| Northern red oak | Good / Good | Good / Good | Good / Good | Fair / Fair |
| Pignut hickory | Fair / Good | Good / Good | Good / Good | Poor / Poor |
| Post oak | Good / Good | Good / Good | Good / Good | Good / Good |
| Red maple | Good / Good | Good / Good | Good / Good | Good / Good |
| Scarlet oak | Fair / Good | Good / Good | Good / Fair | Poor / Poor |
| Shagbark hickory | Fair / Fair | Good / Good | Fair / Fair | Poor / Poor |
| Shortleaf pine | New habitat | Good / Good | Good / Good | Fair / Fair |
| Southern red oak | New habitat | Good / Good | Good / Good | Good / Good |
| Sugar maple | Good / Good | Good / Good | Good / Good | Good / Good |
| Sweetgum | Good / Good | Fair / Good | Good / Good | Good / Good |
| White oak | Good / Good | Good / Good | Good / Good | Good / Fair |
| Yellow-poplar | Good / Good | Good / Good | Good / Good | Fair / Fair |
The regional ratings and the East-wide ratios do not always agree. Table A1 gives tulip tree (Liriodendron tulipifera, the handouts' yellow-poplar) a ratio of 0.807 at RCP 4.5 and 0.766 at RCP 8.5, a loss on the paper's scale (Forest Service, eastern United States, 2019). Three of the four handouts rate it good under both scenarios (Climate Hub, 2024).
The paper makes a like point about the three most common species of each state. More of them lose habitat than gain it, yet being abundant and often adaptable, many may still be plentiful in their states by 2100 (Forest Service, eastern United States, 2019). Its Table 5 gives their ratios under low and then high emissions. In Michigan they are red maple (0.98 and 0.87), sugar maple (0.82 and 0.74) and quaking aspen (0.89 and 0.8) (Forest Service, Michigan, 2019). In Illinois they are American elm (1.29 and 1.47), white oak (0.92 and 0.76) and black cherry (0.77 and 0.66) (Forest Service, Illinois, 2019).
The handouts state one limit plainly: a capability rating may not reflect the outlook for a species with an emerging, severe forest health problem (Climate Hub, Mid-Atlantic, 2024). The paper likewise says its models cannot foresee a future disturbance such as the arrival of an exotic pest (Forest Service, eastern United States, 2019). For two trees in these tables, the guides to Dutch elm disease resistant elms and beech leaf disease report what the authorities say.
A different method for city trees
The regional ratings draw on inventory data for abundance (Climate Hub, Mid-Atlantic, 2024). For urban areas NIACS publishes a separate series of handouts, built another way. They set each species' tolerance range against the urban area's hardiness and heat zones, as they are now and as projected. They add an adaptability score drawn from published tolerance of drought, flooding, pests and disease (NIACS, Washington, D.C., 2020 to 2021).
The fourth table gives the hardiness zones those handouts print for eight urban areas, for 1980 to 2010 and as projected for 2070 to 2099. The handouts carry no date, and NIACS says most of the series was made in 2020 and 2021 and has not been updated (United States, page read 2026).
| Urban area | Hardiness zone, 1980 to 2010 | Hardiness zone, 2070 to 2099, low emissions | Hardiness zone, 2070 to 2099, high emissions |
|---|---|---|---|
| Boston, Massachusetts | 6 to 7 | 7 | 8 to 9 |
| New York, New York | 7 | 8 | 8 to 9 |
| Washington, D.C. | 7 | 8 | 8 to 9 |
| Lexington, Kentucky | 6 to 7 | 7 | 8 |
| Indianapolis region | 6 | 7 | 7 |
| Chicago, Illinois | 5 to 6 | 6 to 7 | 7 to 8 |
| Ann Arbor, Michigan | 6 | 7 | 8 |
| Milwaukee, Wisconsin | 6 | 6 | 7 |
The Washington, D.C. handout calls its tree list a complement to other selection resources. It names other factors to weigh, among them local site conditions and whether nurseries have the tree (NIACS, Washington, D.C., 2020 to 2021). New York City's parks department reported that the street trees in its million-tree program are planted at 2.5 to 3 inch caliper (New York City, 2010). It also reported that many species its foresters specified could not be bought or were scarce, and that it contracted nurseries to grow street trees to its specification (New York City, 2010).
What the projections and the counts do not show
The Forest Service is plain about what its models leave out. They describe habitat that may suit a species, not where it will be found, and a species matched to the future climate may still be held back by competition or browsing (Forest Service, eastern United States, 2019). Adaptability scores describe a species across its whole range, and the paper says managers may adjust a score with local knowledge (Forest Service, eastern United States, 2019).
The modeling stops at a line on the map. West of the 100th meridian, the paper says, the six states the line splits are mostly nonforest or hold western species that were not modeled (Forest Service, eastern United States, 2019). On HortOS, few growers in the Midwest and the West list these eastern species, so a count for a state there is a thin reading. The state pages for Illinois and Michigan show who lists in each.
A grower count does not show quantity, trunk size or where the seed was collected. Those are questions for the grower.
What to watch for
- Reading an East-wide ratio as a local rating. A ratio covers the whole eastern United States. Bur oak gains on that measure and is rated poor in all four regional handouts (Forest Service, 2019; Climate Hub, 2024).
- Treating a high ratio as a sure thing. By the Forest Service's own count, the species gaining habitat are more often the less reliably modeled ones (eastern United States, 2019).
- Taking a regional rating for a street tree rating. The regional handouts weigh abundance from inventory data. The urban handouts use zone suitability and their own adaptability score (NIACS, 2020 to 2021).
- Comparing medians across container sizes. A #3 median and a #45 median are prices of different products, and neither is the price of a caliper tree.
- Carrying eastern figures west. The modeling stops at the 100th meridian, and the climate-ready trees trials are Californian (Forest Service, 2019 and 2018).
Getting it right
- Find the regional handout that covers the planting area. Four are linked under Sources.
- Read a species' capability rating under both scenarios, then look up its East-wide ratio and reliability score in Table A1 of the 2019 paper, and note where the two differ.
- For a street or park planting, read the urban handout for the nearest urban area. The city's forester or tree board decides what goes on its planting list, and is the one to ask how a rating fits local sites.
- Ask a state urban forestry coordinator or an extension forester which pests and diseases in the region bear on the species, since the handouts say a rating may not reflect them.
- See who lists the species among the price pages or in the grower directory, then ask those growers about sizes, quantities, seed source and lead time.
A word of caution
The ratios and ratings on this page are projections by the USDA Forest Service (2019) and the USDA Northern Forests Climate Hub (2024), and both say a model cannot count every factor acting on a species. The urban zone figures are from NIACS handouts mostly made in 2020 and 2021. Grower counts and medians are what HortOS printed, and they change as growers' lists change. A city forester, a state urban forestry coordinator or an extension forester is the one to ask about a site, and the grower about a tree.
Sources
- USDA Forest Service, Analysis of Climate Change Impacts on Tree Species of the Eastern US: Results of DISTRIB-II Modeling: habitat ratios for 125 species. Credit: Iverson, Peters, Prasad and Matthews 2019, Forests 10(4), 302, CC BY 4.0; figures selected.
- USDA Forest Service, Facilitating Adaptive Forest Management under Climate Change: how capability ratings are made. Credit: Iverson, Prasad, Peters and Matthews 2019, Forests 10(11), 989, CC BY 4.0.
- USDA Northern Forests Climate Hub, Climate Change Projections for Individual Tree Species: Mid-Atlantic Region: capability ratings, Mid-Atlantic.
- USDA Northern Forests Climate Hub, Climate Change Projections for Individual Tree Species: New England and Northern New York: capability ratings, New England.
- USDA Northern Forests Climate Hub, Climate Change Projections for Individual Tree Species: Central Appalachians: capability ratings, Central Appalachians.
- USDA Northern Forests Climate Hub, Climate Change Projections for Individual Tree Species: Illinois: capability ratings, Illinois.
- Northern Institute of Applied Climate Science (NIACS), Urban Forests: Tree Species Vulnerability Handouts: how the urban handouts rate.
- NIACS, Climate Change Vulnerability of Urban Trees: Washington, D.C.: zones and method.
- NIACS, Climate Change Vulnerability of Urban Trees: Boston, Massachusetts: projected hardiness zones.
- NIACS, Climate Change Vulnerability of Urban Trees: New York City: projected hardiness zones.
- NIACS, Climate Change Vulnerability of Urban Trees: Lexington, Kentucky: projected hardiness zones.
- NIACS, Climate Change Vulnerability of Urban Trees: Indianapolis region, Indiana: projected hardiness zones.
- NIACS, Climate Change Vulnerability of Urban Trees: Chicago, Illinois: projected hardiness zones.
- NIACS, Climate Change Vulnerability of Urban Trees: Ann Arbor, Michigan: projected hardiness zones.
- NIACS, Climate Change Vulnerability of Urban Trees: Milwaukee, Wisconsin: projected hardiness zones.
- USDA Forest Service, Mid-Atlantic Forest Ecosystem Vulnerability Assessment and Synthesis (General Technical Report NRS-181), Appendix 1: common and scientific names.
- USDA Forest Service Pacific Southwest Research Station, Performance testing to identify climate-ready trees: the California trials.
- New York City Department of Parks and Recreation, Tree Procurement Contracts: New York City's Quest for Amazing Trees: a city's tree growing contracts.
More guides

Street Trees and Canopy: What Advanced Stock Costs and Who Holds It
A standing reference for urban forestry programs and tree nonprofits: the trees the American trade grows for streets and parks, the nursery-gate median at #15, #30, #45 and #65 and as field grown stock, how many growers in each state hold advanced stock, why lead times run to years, and what a street tree costs against a giveaway.
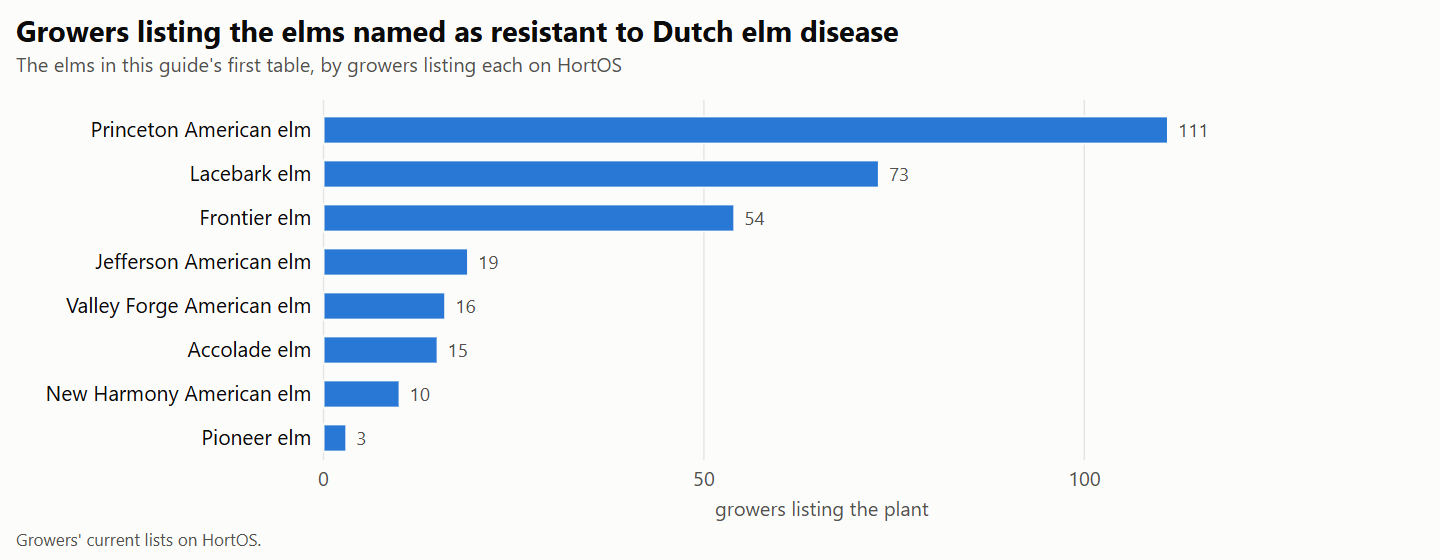
Dutch elm disease resistant elms and the growers that list them
For city foresters, shade tree committees and arborists choosing elms. It sets the American elm selections, hybrids and lacebark elm that universities and federal agencies name as resistant beside the growers listing each, with national trade medians. It reports how each fared in the National Elm Trial, one caution on record for each, and why resistance is not immunity.
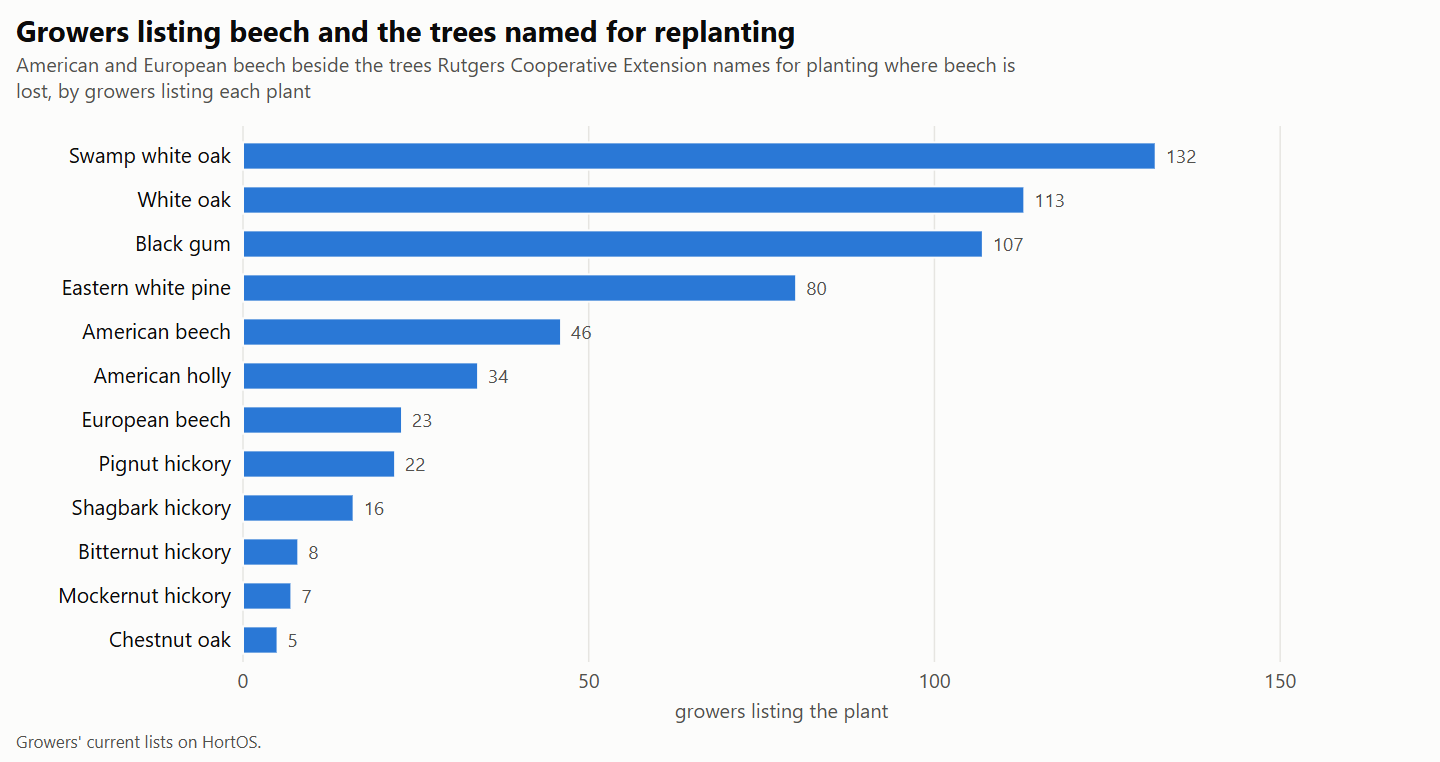
Beech leaf disease and the trees planted where beech is lost
For urban foresters and land trusts in the Northeast, Ohio and Michigan. It reports what Penn State Extension and state agencies say about beech leaf disease, sets out the trees Rutgers Cooperative Extension and the Scott Arboretum name for replanting, and adds the growers listing each tree, with a container median where three growers price a size.