What the research says trees and landscaping add to a home's value
A study by study account of what American research found trees and landscaping add to a home's value: the seven-state perceived value survey, the Portland and Minnesota sale price models and eight more, each with its method and what it leaves out. A separate section shows what growers list for yard trees and shrubs.
Updated September 14, 2026. Figures are what the live us.hortosapp.com price and plant pages printed.
On this page
- Quick facts
- Opinion surveys and sale price models measure different things
- How the 15 percent line compares with the studies
- The studies side by side, with what each leaves out
- What growers list for yard trees and shrubs
- What neither the studies nor the trade lists show
- What to watch for
- Getting it right
- A word of caution
- Sources
A credit union editor updating a curb appeal post wants to know whether landscaping or a street tree really raises what a house sells for, and by how much. Virginia Cooperative Extension (2023) notes that 15 percent is often stated as what an attractive landscape adds to a home's perceived value, and asks whether the figure is reliable. Each figure the research gives belongs to one place and one method, and the two methods, a survey of opinions about photographs and a model of recorded sale prices, do not measure the same thing.
This page reads Virginia Cooperative Extension's summary of a seven-state survey, three papers by USDA Forest Service researchers and their co-authors, one of them written with the University of Minnesota, and a University of Washington review. It adds what growers list for some yard trees and shrubs on HortOS, a free directory of American wholesale plant growers with their published availability and trade prices. It is not an appraisal and promises no return. The only values put on standing trees are the studies' own findings.
Quick facts
| The 15 percent line | Virginia Cooperative Extension (United States, publication reviewed 2023) reports that 15 percent is the figure often stated for what an attractive landscape adds to a home's perceived value, and asks whether it is reliable. |
|---|---|
| The seven-state survey | In a 1999 survey in seven states, people rating photographs put a well landscaped house above the same house with lawn only by 5.5 percent in the lowest state and 11.4 percent in the highest. That is perceived value, not a sale price (Virginia Cooperative Extension summary, United States, reviewed 2023). |
| Design, size and plant type | In the publication's table the seven-state survey of 1999 gave design sophistication 42 percent, plant size 36 and plant type 22. The three total one hundred, so they are shares of the landscape's added value, not of the home's price (figures: Virginia Cooperative Extension summary, United States, reviewed 2023). |
| Portland street trees | A sale price model of home sales in east-side Portland, Oregon, from July 2006 to April 2007 found that street trees added $8,870 on average, 3.0 percent of the median sale price (USDA Forest Service, 2010). |
| Minnesota tree cover | A sale price model of 2005 home sales in Ramsey and Dakota Counties, Minnesota, found that 10 percentage points more tree cover within 100 meters added $1,371, or 0.48 percent, to the average sale price (USDA Forest Service and University of Minnesota, 2010). |
| The 3 to 15 percent range | A University of Washington review (United States, 2010) gives 3 to 15 percent for larger yard and street trees, and a trend across studies of about 7 percent. The 10 to 15 percent line of its table rests on a 2002 study of mature trees in Quebec City, Canada. |
Opinion surveys and sale price models measure different things
Two methods sit behind the figures on this page. A perceived value survey shows people pictures and asks what a house seems to be worth. A sale price model, which economists call a hedonic model, estimates from recorded sales how much of each price goes with a feature such as a tree. The University of Washington review (United States, 2010) names the second method's advantage: it works from real market transactions, where a questionnaire poses a hypothetical.
Virginia Cooperative Extension (publication reviewed 2023) summarizes one such survey. In 1999, visitors to home and garden shows in seven states saw a photograph of a new suburban house with a lawn, a concrete path and nothing else. They then saw 16 more photographs of that house, each with a different mix of plant size, plant type and design. The states were Texas, Louisiana, Mississippi, Kentucky, the two Carolinas and Delaware.
Respondents ranked design first, plant size second and the mix of plant types third. The publication's table gives the three factors 42, 36 and 22, in a column headed as the percent of value added to the home. The figures total one hundred, so they divide the landscape's added value among the factors and are not shares of the home's price. A Michigan survey of the same year, using the same method, put plant size first.
From lawn only to a well landscaped house, perceived value rose by 5.5 percent in the lowest of the seven states and 11.4 percent in the highest. The same summary reports that the barest plantings, plain in design and small in plant size, took value away. Virginia Cooperative Extension (2023) concludes that large landscape spending raises perceived value and will bring a higher selling price than a minimal landscape. The survey it summarizes rated photographs, and the publication reports sale price research from Greenville, South Carolina, beside it.
How the 15 percent line compares with the studies
The gains in value that Virginia Cooperative Extension (2023) goes on to report are all below 15 percent. Beside the survey, it cites research on home sales in Greenville, South Carolina, conducted in 1996 and 1997. That study found price premiums of 4 to 5 percent for a landscape raised from average to good, and 6 to 7 percent from good to excellent. The publication adds the two steps to reach 10 to 12 percent from average to excellent.
The University of Washington review (United States, 2010) gives a wider range: larger trees in yards and along streets can add 3 to 15 percent to home values. Its table starts at 2 percent for mature yard trees. Its top line, 10 to 15 percent, is for mature trees in high-income neighborhoods, and the reference behind it is a 2002 study of Quebec City, Canada. The review puts the trend across studies at about 7 percent on price. It adds that the effect depends on how the presence of trees is defined and on the neighborhood, with larger gains in lower-quality neighborhoods. It also cautions that valuation of this kind is full of assumptions and uncertainty.
The studies side by side, with what each leaves out
The table sets out 11 United States studies of what landscaping, yard trees, street trees or tree cover add to the perceived value, sale price or rent of a single-family home. Each is reported by a source read for this page with a place, a method and a figure. For Lehigh County the summary gives a direction and no size of effect. The table is a selection and does not hold every study those sources mention. Studies from other countries are not in it, nor are studies of vacant lots, parks, open space, forest views or forest health.
Three rows rest on the papers themselves: the two Portland studies and the Minnesota study. The other eight were read through the summary named in the last column. The first column gives the period of the survey, sales or listings for the two surveys and the Portland and Minnesota rows. For the Greenville row it gives the years of the research, and for the other five rows the year the summary cites.
| Study | Method | Finding | What it leaves out | Read in |
|---|---|---|---|---|
| Seven-state survey, 1999 | Perceived value survey of visitors at home and garden shows | Perceived value rose by 5.5 percent in the lowest of the seven states and 11.4 percent in the highest, from lawn only to a full landscape | Sale prices: respondents rated photographs of one new house | Summary in Virginia Cooperative Extension 426-087, reviewed 2023 |
| Michigan survey, 1999 | Same photograph method, run at a flower show | Perceived value was 12.7 percent higher for the top rated landscape than for the lowest rated | Sale prices: the answers are flower show visitors' ratings | Summary in Virginia Cooperative Extension 426-087, reviewed 2023 |
| Portland, Oregon, east side, sales from July 2006 to April 2007 | Sale price (hedonic) model of street trees | Street trees added $8,870 on average to the sale price, 3.0 percent of the median | The other tree measures: only the count of street trees and the crown area within 100 feet were significant | USDA Forest Service paper, 2010 |
| Ramsey and Dakota Counties, Minnesota, sales of 2005 | Sale price (hedonic) model of tree cover around each home | Ten percentage points more tree cover within 100 meters added $1,371 (0.48 percent) to the average sale price | Single trees, tree sizes and species: the study did not value them | USDA Forest Service and University of Minnesota paper, 2010 |
| Greenville, South Carolina, 1996 to 1997 | Sale price study of landscape quality | Price premium of 4 to 5 percent from average to good landscaping and 6 to 7 percent from good to excellent | Plant sizes and species: the summary gives only the steps from average to good to excellent | Summary in Virginia Cooperative Extension 426-087, reviewed 2023 |
| Athens, Georgia, 1988 | Sale price study counting front-yard trees in listing photographs | A front-yard tree added $422, or 1.1 percent, to the sale price | Tree measurements: trees were counted from photographs and not measured | Summaries in the USDA Forest Service Portland papers of 2010 and 2011 |
| Manchester, Connecticut, 1980 | Sale price study of 60 houses, tree cover marked good or not | Good tree cover added 6 percent to the sale price | Amounts of tree cover: the Portland paper's authors call the small sample and the yes or no measure major limitations | Summary in the USDA Forest Service Portland paper, 2010 |
| Baton Rouge, Louisiana, 2000 | Sale price study, lots with mature trees marked yes or no | Homes with mature trees on the lot sold for about 2 percent more | Tree counts, sizes and species: one yes or no marker stood for mature trees | Summary in the USDA Forest Service and University of Minnesota paper, 2010 |
| Research Triangle, North Carolina, 2005 | Sale price study of forest cover on the lot and nearby | Ten percent more forest cover on the lot added less than $800; adjoining a private forest added more than $8,000 | Planted landscaping: the measures are forest cover and distance to forests | Summary in the USDA Forest Service and University of Minnesota paper, 2010 |
| Lehigh County, Pennsylvania, 2008 | Sale price and time on market study of 3,088 home sales | Mature trees on the property raised the sale price; trees that overhung a side of the house lowered it | Tree sizes as measured: trees were recorded with yes or no markers, such as trees taller than 35 feet behind the home | Summary in the USDA Forest Service Portland paper, 2010 |
| Portland, Oregon, rental listings from October 2009 to January 2010 | Rent (hedonic) model of single-family houses advertised on one listings website | A tree on the lot added $5.62 to monthly rent; a street tree added $21.00 | Rentals advertised elsewhere: the authors say the result strictly applies only to that website's listings | USDA Forest Service paper, 2011 |
The summaries do not agree on the Athens, Georgia study. Both Forest Service Portland papers (2010 and 2011) report $422 for a front-yard tree, which the 2011 paper gives as 1.1 percent of the sale price. The Minnesota paper (2010) reports 3.5 to 4.5 percent more where a front yard held more than five trees, a mean of $343 a tree. The table carries the first reading.
The Portland researchers measured the diameter and height of each street tree and recorded its type. Their final sample was 2,608 houses with a median price of $259,000 (USDA Forest Service, Portland, Oregon, 2010). Only two of the tree measures tested were significant: the number of street trees, and the crown area within 100 feet of the house. At their average values the two together added $8,870 to the sale price.
The paper also follows one tree. A street tree with the sample's average canopy of 312 square feet added $7,130 to the sale price of the house behind it. It added a further $12,828, on average, spread across the neighboring houses (USDA Forest Service, Portland, Oregon, 2010). The Forest Service's own summary (Pacific Northwest Research Station, 2010) puts the share of the owner with the tree in front at only about a third of the total benefit.
In the same Portland model (USDA Forest Service, 2010), crown area on the house's own lot was not significant. Tree height mattered only when ZIP codes were left out of the model, and the authors note that tall trees stand disproportionately in some expensive neighborhoods. Street trees cut the days a house spent for sale by 1.7 on average, an effect the paper values at $88 and calls "economically irrelevant". The authors caution that carrying the result to other cities may be a problem.
The Minnesota study measured tree cover, not single trees, around 9,992 single-family homes sold in 2005 (USDA Forest Service and University of Minnesota, 2010). In one form of its model, price rose with tree cover within 100 and 250 meters up to 40 to 60 percent cover, and more cover beyond that went with a lower price. The paper found much less evidence that buyers pay more for tree cover on the home's own lot. It put no figure on a single tree, a tree size or a species. Its authors call such a model a partial estimate: it catches only the value that reaches owners of single-family homes.
What growers list for yard trees and shrubs
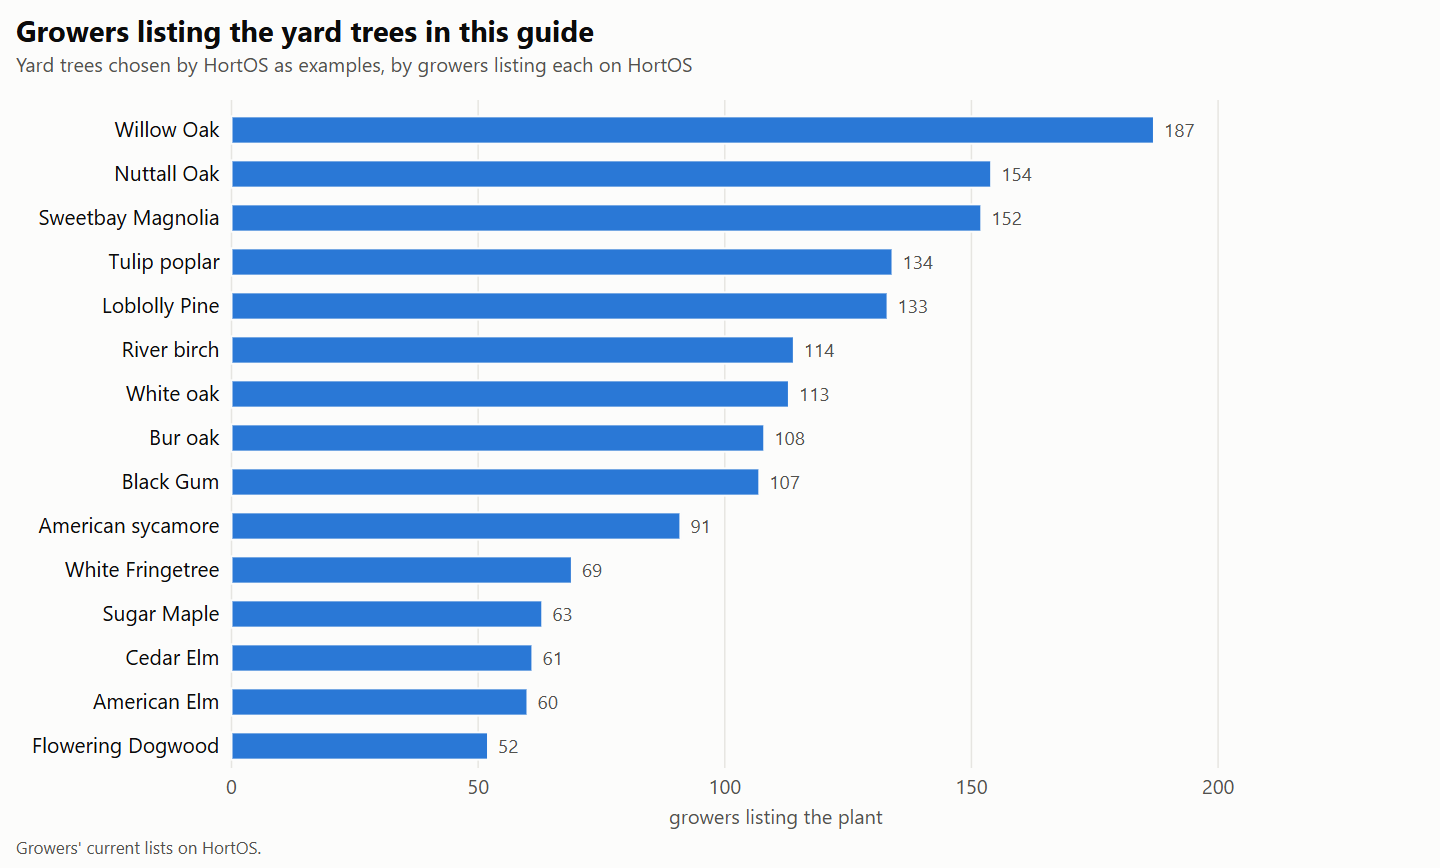
The two tables here answer a separate question from the studies: what growers list for trees and shrubs of the kind a yard planting uses. The plants are HortOS's own examples, chosen by no study. The first table holds 15 trees, shade and flowering kinds and one pine, each the species and not a named variety, at #15 and #30. It repeats no tree tabled in the guide to what a tree costs by container size and caliper, which has red maple, Shumard oak and eastern redbud, or in the guide to street trees and canopy. Prices are medians across growers' current trade lists on HortOS: one price per grower, ex tax, freight not included, with the number of growers pricing each size in brackets. Grower counts are the growers listing each plant on HortOS, in any size. A count here is growers listing the plant, not how many plants exist or how well it suits a site. Anyone can see the prices on HortOS, and only the trade can order.
| Plant | Growers listing it | #15 median (growers pricing) | #30 median (growers pricing) |
|---|---|---|---|
| American Elm (Ulmus americana) | 60 | $55 (10) | $125 (7) |
| American sycamore (Platanus occidentalis) | 91 | $60 (16) | $121 (14) |
| Black Gum (Nyssa sylvatica) | 107 | $70 (11) | $125 (3) |
| Bur oak (Quercus macrocarpa) | 108 | $90 (8) | $117.50 (12) |
| Cedar Elm (Ulmus crassifolia) | 61 | $62.50 (6) | $125 (11) |
| Flowering Dogwood (Cornus florida) | 52 | $100 (3) | Fewer than three growers |
| Loblolly Pine (Pinus taeda) | 133 | $59 (35) | $112.50 (18) |
| Nuttall Oak (Quercus texana) | 154 | $60 (23) | $125 (30) |
| River birch (Betula nigra) | 114 | $65 (14) | $125 (20) |
| Sugar Maple (Acer saccharum) | 63 | $105 (4) | Fewer than three growers |
| Sweetbay Magnolia (Magnolia virginiana) | 152 | $62.50 (32) | $125 (24) |
| Tulip poplar (Liriodendron tulipifera) | 134 | $60 (22) | $127 (6) |
| White Fringetree (Chionanthus virginicus) | 69 | $70 (10) | $200 (3) |
| White oak (Quercus alba) | 113 | $60 (14) | $147.50 (4) |
| Willow Oak (Quercus phellos) | 187 | $60 (35) | $125 (24) |
The growers listing the plants in this table are spread across many states; the most are in Florida, Texas and North Carolina.
Some of these medians rest on few growers. The #30 median of white oak comes from 4 growers, that of black gum from 3 and that of white fringetree from 3. A median on so few growers is a thin figure, and it moves when one grower changes a price. Of the two sizes shown, flowering dogwood and sugar maple have a median at #15 only, the first from 3 growers and the second from 4, so their rows show no step in size. A median needs three growers pricing a size. The guide to nursery pot sizes explains how a container class such as #15 is defined.
The second table holds 9 shrubs, again HortOS's own examples and each the species, at #3 and #7. Its figures have the same basis as the tree table's.
| Plant | Growers listing it | #3 median (growers pricing) | #7 median (growers pricing) |
|---|---|---|---|
| Arrowwood viburnum (Viburnum dentatum) | 66 | $16 (17) | $26 (3) |
| Chinese Fringe Flower (Loropetalum chinense) | 33 | $6.00 (17) | $18.50 (8) |
| Common Witch Hazel (Hamamelis virginiana) | 54 | $22 (11) | $50 (5) |
| Dwarf Witchalder (Fothergilla gardenii) | 36 | $18 (9) | Fewer than three growers |
| Oakleaf Hydrangea (Hydrangea quercifolia) | 75 | $11.32 (26) | $28 (13) |
| Southern Wax Myrtle (Myrica cerifera) | 225 | $8.00 (91) | $21 (73) |
| Summersweet (Clethra alnifolia) | 44 | $22 (9) | Fewer than three growers |
| Walter's viburnum (Viburnum obovatum) | 56 | $6.25 (24) | $22.50 (19) |
| Yellow Anise (Illicium parviflorum) | 69 | $7.25 (38) | $21 (35) |
Most of the growers listing the plants in this table are in Florida, North Carolina and Texas.
The #7 median of arrowwood viburnum comes from 3 growers and is thin in the same way.
What neither the studies nor the trade lists show
No study read for this page prices a nursery container class. A trade median is what growers list a container at on one date. It is not the value of a planted, established or mature tree, and it says nothing of planting, freight or what a homeowner pays.
The word size means three different things in these sources. In the survey it is the size of the plants in a photograph of a new landscape, given in Virginia Cooperative Extension's summary (2023) only as small, medium or large. In the Portland and Minnesota models it is what stood around homes already sold: tree counts, crown area and tree cover (USDA Forest Service papers, 2010). A USDA Forest Service leaflet (United States, 2004) sorts trees by their size about 40 years after planting: small-stature trees are under 25 feet tall and wide, and large-stature trees more than 40 feet. That leaflet (USDA Forest Service, United States, 2004) argues for large-stature trees on the yearly net benefits its center measured at places in the West, and accepts that a small-stature tree may be the best choice on some restricted sites.
A finding from Portland, from two Minnesota counties or from seven survey states is a finding for those places. The trade medians are national figures, not the price in any one state, and a grower's state and climate change what is listed and in what size. The hubs for Oregon, Minnesota and Texas show the growers in each state.
What to watch for
- Quoting a survey figure as a sale price. The 5.5 to 11.4 percent of the seven-state survey is a change in perceived value, taken from ratings of photographs (Virginia Cooperative Extension summary, reviewed 2023).
- Reading 42, 36 and 22 as percentages of a home's price. The three total one hundred, so they split the landscape's added value among design, plant size and plant type (figures: Virginia Cooperative Extension summary, reviewed 2023).
- Assuming more trees always add more. In the Minnesota model price fell once nearby tree cover passed 40 to 60 percent (USDA Forest Service and University of Minnesota, 2010). In a Lehigh County, Pennsylvania study, trees overhanging the house lowered the price (as summarized by the USDA Forest Service, 2010).
- Setting a trade median against a study's figure. One is what growers list a container at. The other is an estimate for trees standing around homes that sold.
Getting it right
- Beside any figure, name the study's institution, place and method, and the year of its sales or survey. Link the paper or the institution's summary.
- Give a range with both ends, and say what the top end rests on.
- What one house is worth is settled by its sale, and an estimate beforehand is an appraiser's to make. Ask the appraiser which recent local sales were compared and how trees and landscaping were treated.
- For what to plant on one site, ask the local extension office or a certified arborist what mature size fits the space. Texas A&M AgriLife Extension (Travis County, Texas, read 2026) says to choose a tree to fit the soil, the climate and the space, and notes that large shrubs set under windows end up being cut back hard.
- For trade prices, a landscape contractor or other trade buyer asks each grower for a quote by species, container class and quantity. The grower sets the price and the terms.
A word of caution
The findings on this page are those of the studies named, each for its own place, period and method. They are given here as reported by the University of Washington, the University of Minnesota, Virginia Cooperative Extension and the USDA Forest Service with its co-authors. None is a forecast for another house. What one property is worth is for an appraiser to say, and what to plant on one site is for the local extension office or an arborist.
Sources
- Virginia Cooperative Extension, The Effect of Landscape Plants on Perceived Home Value: the seven-state survey summary.
- USDA Forest Service, Trees in the city: Valuing street trees in Portland, Oregon (2010): street trees and sale prices.
- USDA Forest Service, Science Findings issue 126: the Station's summary of the study.
- University of Washington, Green Cities: Good Health, Local Economics: review of tree value studies.
- USDA Forest Service and University of Minnesota, The value of urban tree cover (2010): Minnesota tree cover and sale prices.
- USDA Forest Service, The effect of urban trees on the rental price of single-family homes in Portland, Oregon (2011): trees and house rents.
- USDA Forest Service, The Large Tree Argument (2004): tree stature classes at maturity.
- Texas A&M AgriLife Extension Service, Travis County, Trees and Tree Care: choosing tree and shrub size.
More guides

What a Tree Costs at the Nursery, by Container Size and Caliper
A tree has a knowable wholesale price before freight, planting and margin are added, and the container size sets it far more than the species does. This page gives the trade prices for seven widely grown American trees at every size three or more growers publish, with the sizing rules behind them.

Street Trees and Canopy: What Advanced Stock Costs and Who Holds It
A standing reference for urban forestry programs and tree nonprofits: the trees the American trade grows for streets and parks, the nursery-gate median at #15, #30, #45 and #65 and as field grown stock, how many growers in each state hold advanced stock, why lead times run to years, and what a street tree costs against a giveaway.

Nursery Pot Sizes Explained: Millimetres, Litres and Gallons
Australian growers name a pot by its rim diameter up to 400 mm and by its volume in litres above that, while American growers use gallon classes. This guide explains each step of the ladder, the approximate height and age behind it, how to convert between systems, and what the trade pays at every size.